Wiener Schnitzler – Schnitzler's Vienna

A geographical mapping by Martin Anton Müller and Laura Untner

Historical black and white view of Vienna, circa 1900, showing the city center and Danube CanalStylized silhouette of Arthur Schnitzler with hat and glasses against historic Vienna backdrop

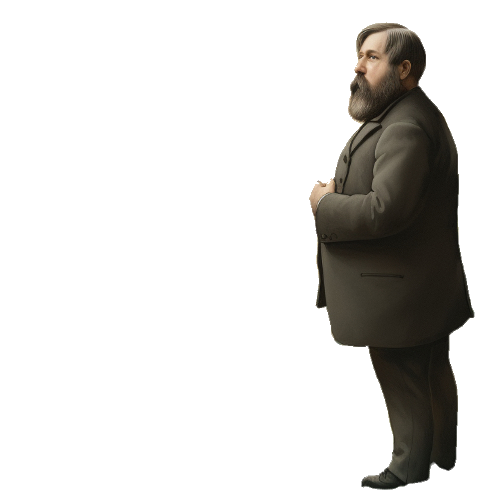
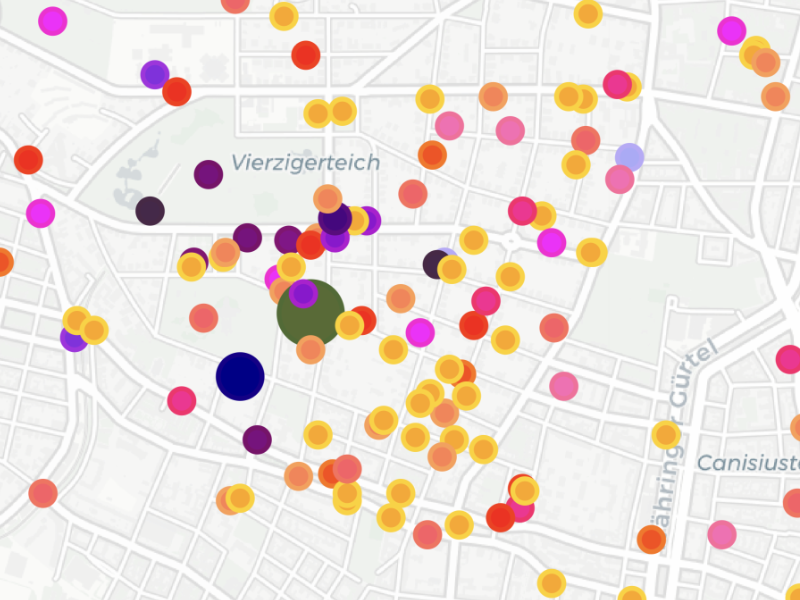
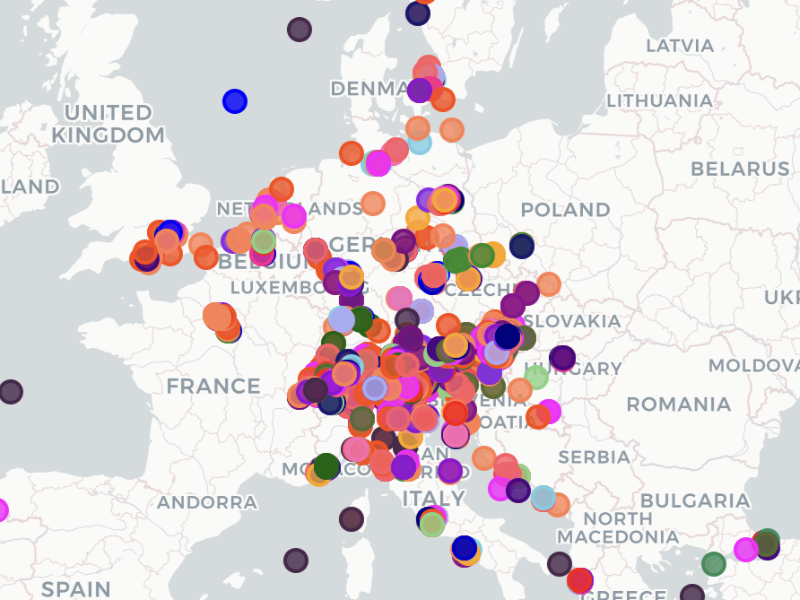
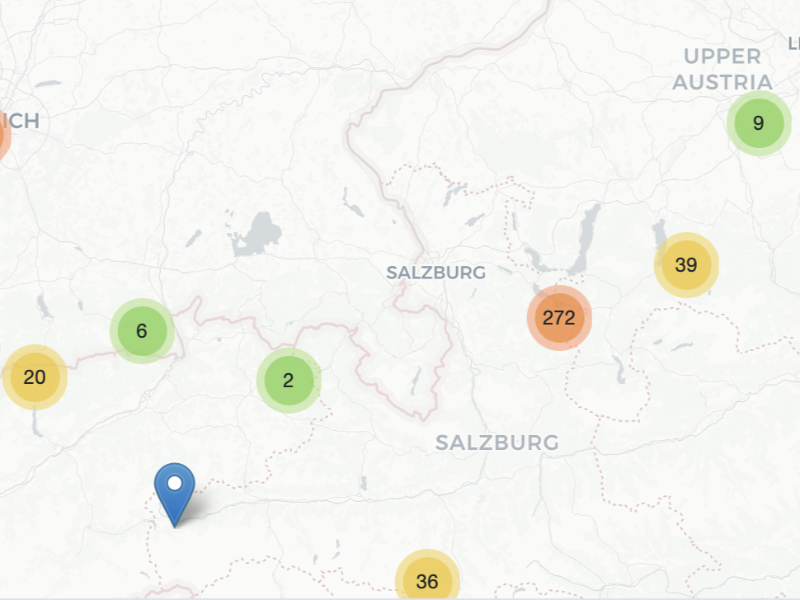
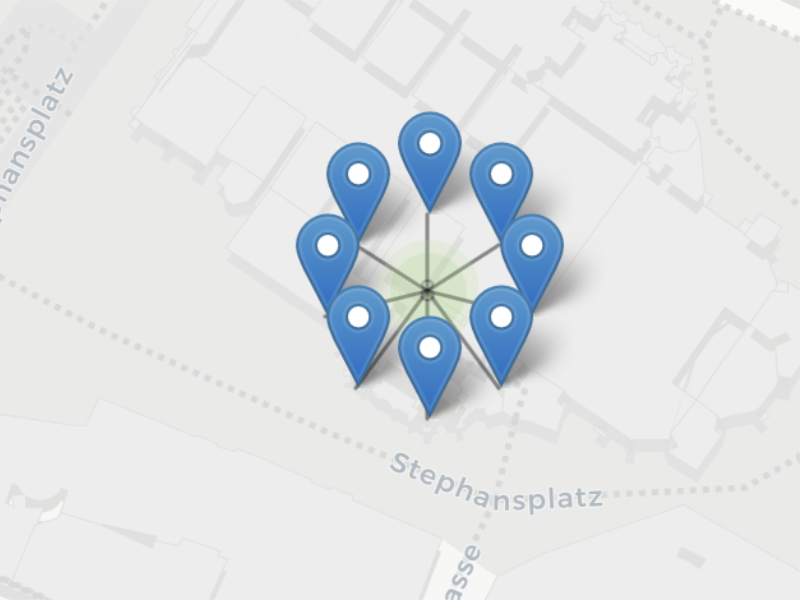
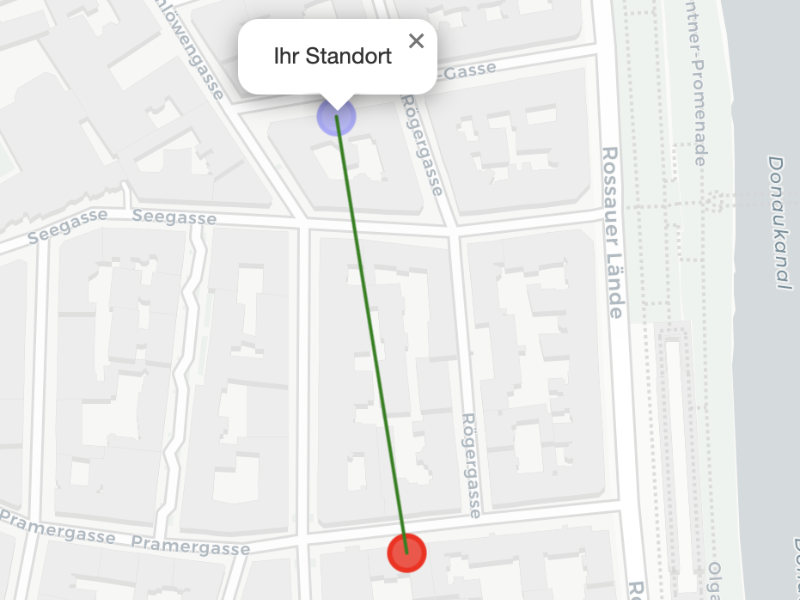
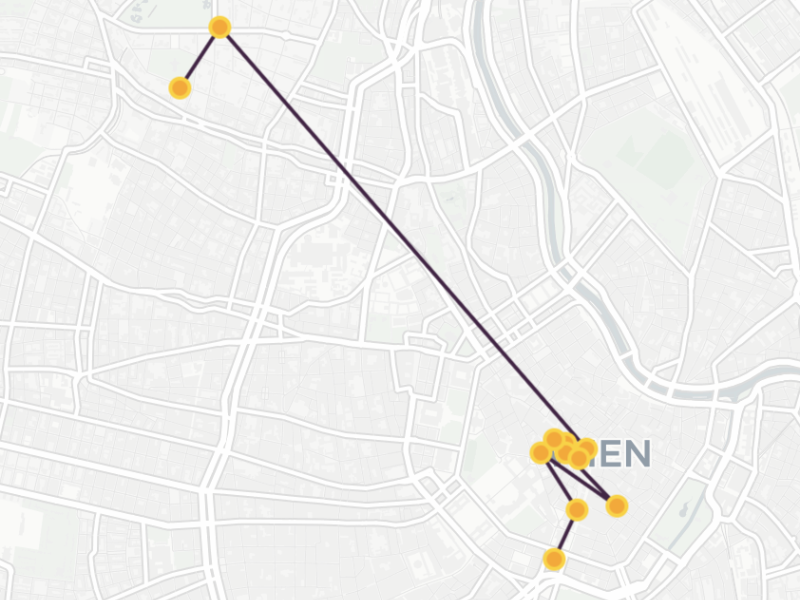
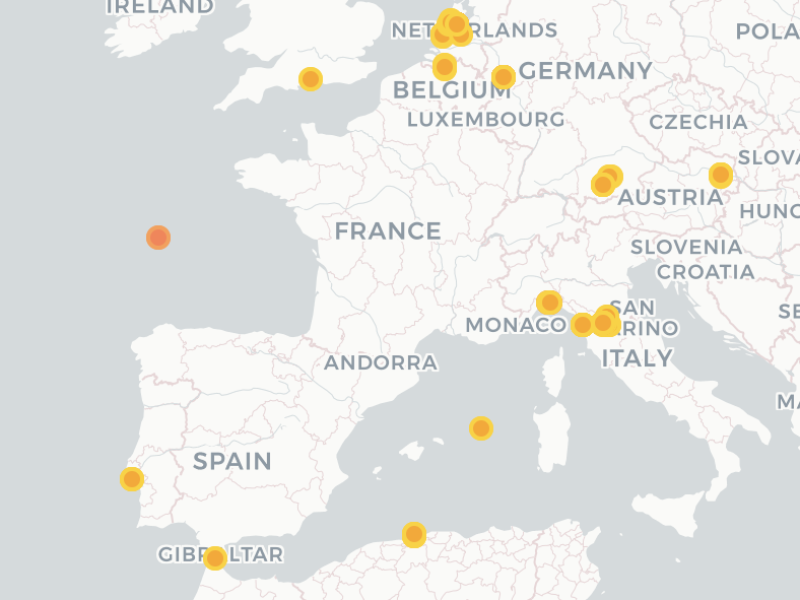
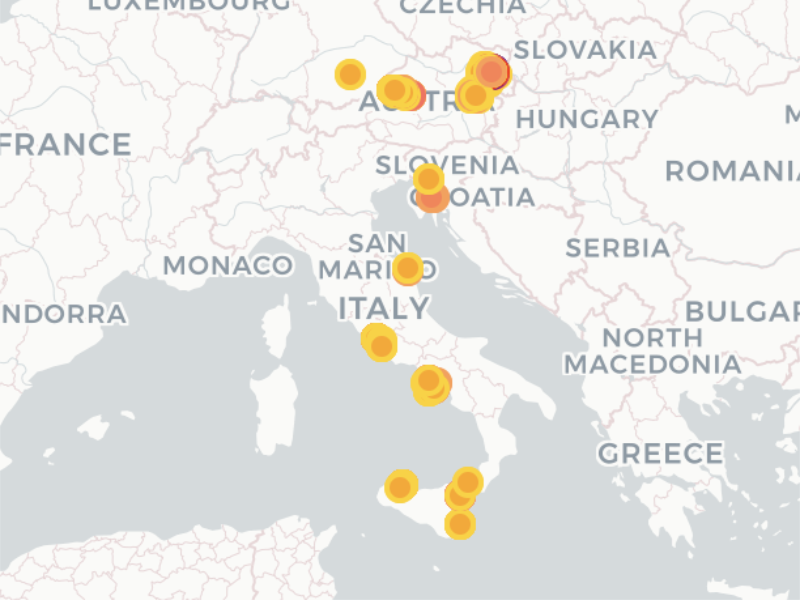
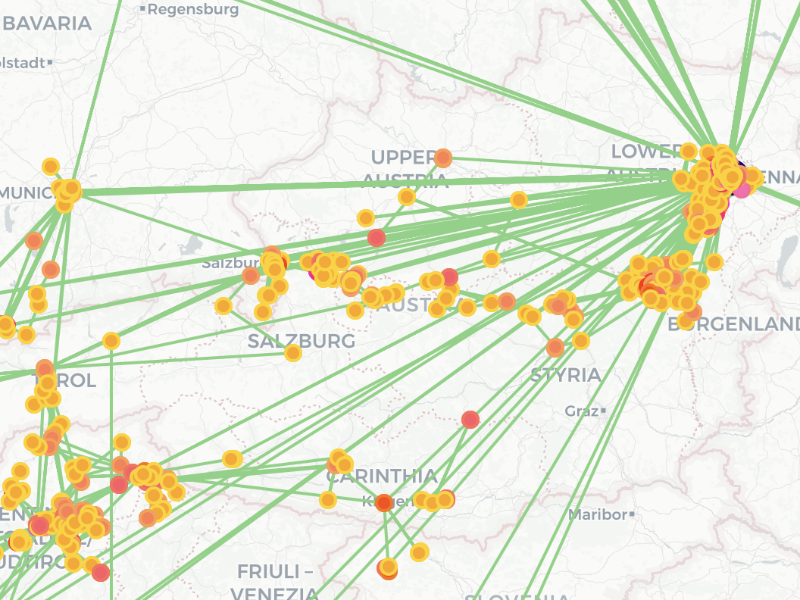
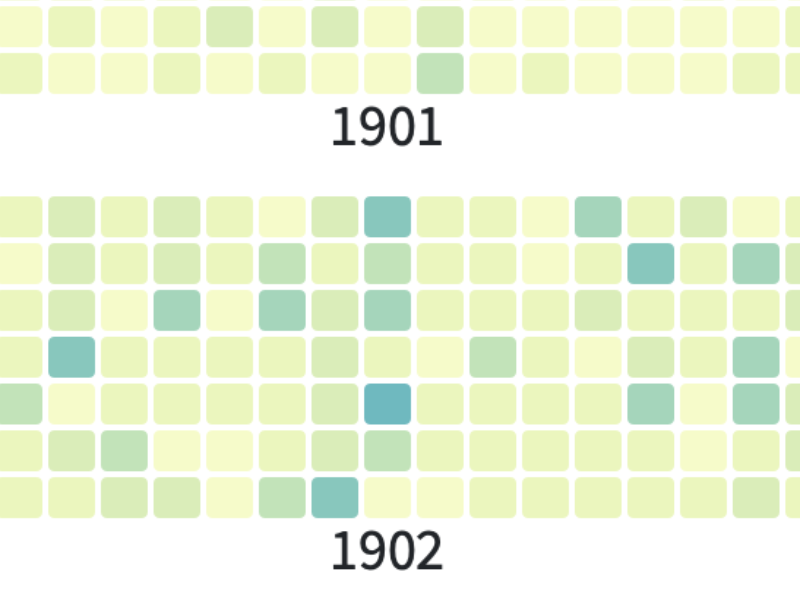
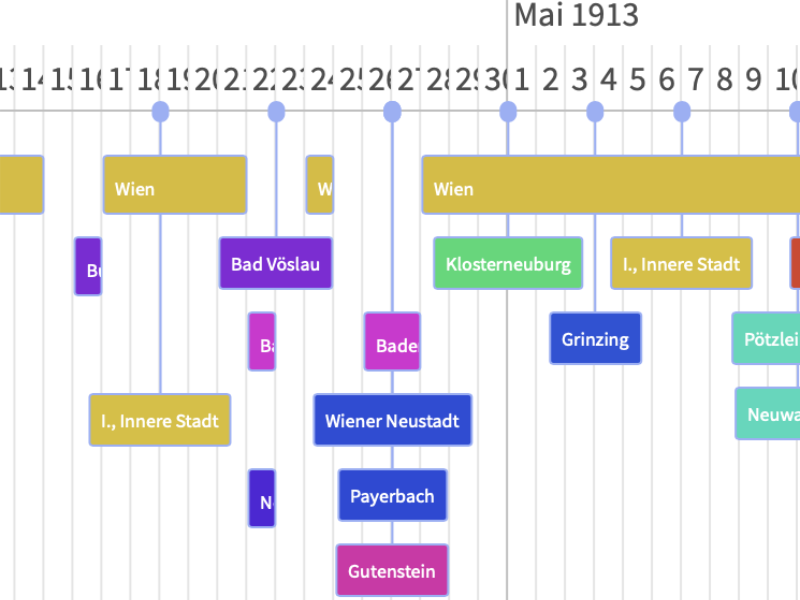
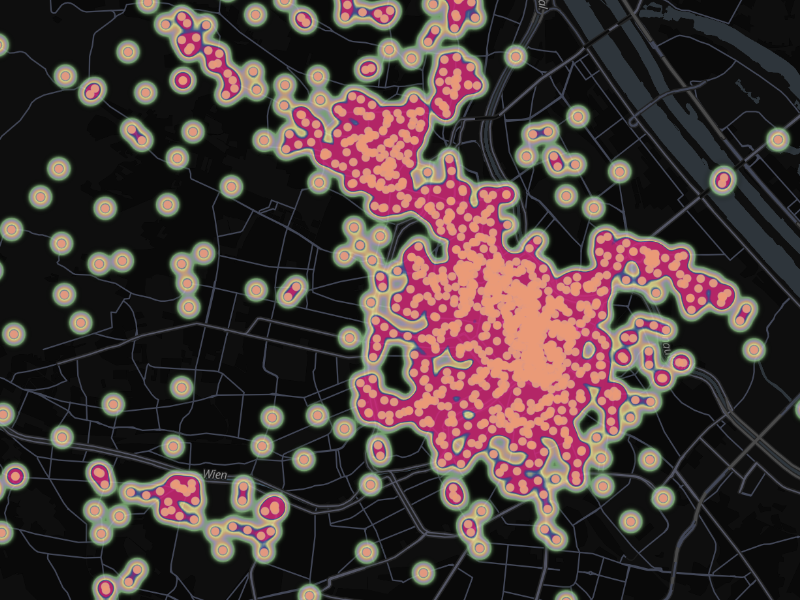
Arthur Schnitzler was born in 1862 in Vienna on Praterstraße and died in 1931 on Sternwartestraße, barely ten kilometers away. He wrote successful plays, novels, and stories, most of which are set in Vienna. He only left the city for travels and summer stays. Thanks to his diary, his correspondence and other documents, we currently record over 47,000 stays at nearly 4,950 locations. Currently, there is no other person of his time with as much freely available and georeferenced data. This shows where Schnitzler moved, which houses, streets, districts, cities, and countries he knew, and which were important to him. At the same time, you can see where he never stayed.

Interactive map with colored dots showing the frequency of Schnitzler's stays at various locations

At which locations did Schnitzler stay most frequently? A map by days of stay.

Map with filter options for location types such as museum, theater, café, residence, or park

Which museums did Schnitzler visit? A quick answer can be found in the types of stays.

Tabular listing of all locations with names, coordinates, days of stay, and known residents

Look up locations and their residents in the directory .

List of place names from diary and letters that have not yet been assigned to a geographical position

We didn't always succeed. Here are currently unidentified places.

Interactive feature to calculate at which location Schnitzler was closest to you in time

Where you were closest to Schnitzler can be queried via Schnitzler and Me .

Date selection to display all locations on a specific day

For each single day there is a separate map.

Calendar selection to visualize all locations of a specific month across all years

Also months of the calendar can be visualized.

Year selection between 1862 and 1931 to display all locations of a specific year

Where was Schnitzler in a specific year?

Selection by decades to show Schnitzler's travel behavior in different life phases

Schnitzler's sojourns in the individual decades.

Diagram showing temporal distribution of known locations and data density over the years

How many locations on specific days do we know? An overview.

Chronological timeline showing locations along a time axis from 1862 to 1931

The timeline shows the visited places chronologically.

Screenshot of Kepler.gl web application for free data exploration and visualization

Custom views of the data can be quickly created with kepler.gl .

GitHub logo - link to public code repository with TEI-XML data and GeoJSON files

For people with a strong desire to play: All source data is freely available on GitHub .